
Bug #6570
open
Concurrent Performance Issues SaxonEE10-9N (dotnet)
0%
Description
Hello there,
We're using SaxonEE10-9N in our dotnet application to transform for XSLT transformations. We've noticed under a light load (e.g. 10 concurrent requests) the performance degrades drastically. For example, in my local machine, I run 10 concurrent requests, it takes about 30 sec or more to complete each transform. If I increase the number to say 25, I see transform times go up to 100 seconds per transform.
Please see attach dotnet example I've attached to repro this issue.
Files
 Updated by Michael Kay 3 months ago
Thanks for reporting it.
I've deleted the attached ZIP file because it contained a Saxon licence key.
What level of CPU and memory utilisation are you seeing? If the CPU is fully utilised with 10 threads, then (unless you have more than 10 CPUs) doubling the number of threads means that each thread will take twice as long to complete, which would account for your observations.
I guess this is a synthetic workload, but in real life it's common to run the same transformation on many source documents, and in that situation you can get a big performance benefit by only compiling the stylesheet once.
If your monitoring tools show any lock contention within Saxon, then it would be useful to know about that.
Saxon10 on .NET is still supported, because .NET Framework 4.8 is still supported. However, it is becoming increasingly unlikely that we will produce any further maintenance releases for Saxon10, and we wouldn't do so for a performance issue unless it makes the product completely unusable.
 Updated by Arif Yayalar 3 months ago
Hi Michael,
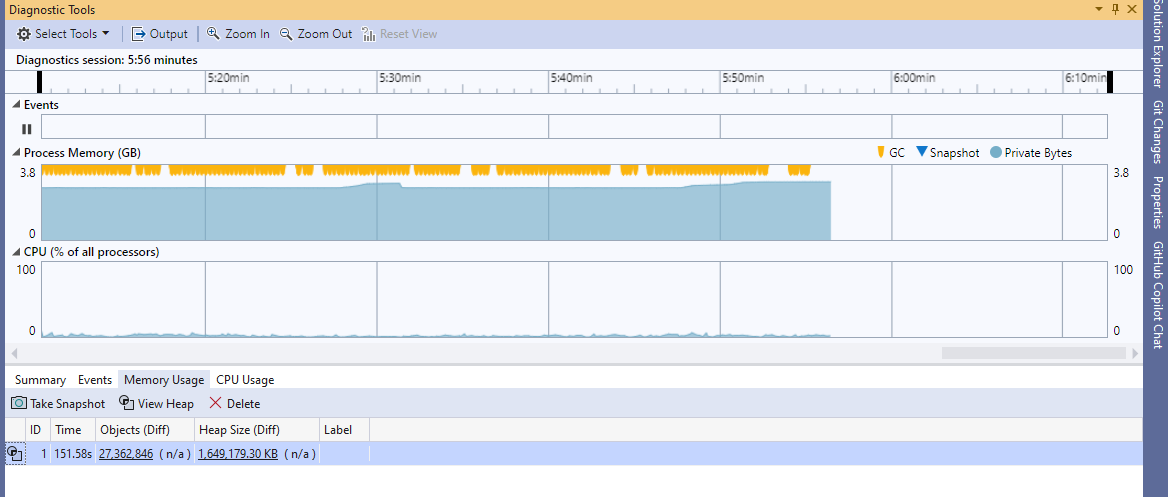
Thanks for replying back and deleting the file. Unfortunately we cannot cache/compile once. We have quite of few of them (in the 1000s). I don't know if you had a chance to run the solution locally but just 10 concurrent calls taking 30+ seconds each. As far as CPU utilization is around %10 but I see spikes up to %50-60. Memory utilization it starts around 500mb but consistently climbs up. I see numbers around 3.8 GB five minutes into the test. A lot of GC activity as well (see attached screen shot)
As far as the version of the software, isn't SaxonEE10-9N latest? If not could you point me where I can download the latest?
I am also curios if we're using the library efficiently. Do you see any issues in the code base we should be aware of?
Thank you,
Arif
Updated by Michael Kay 3 months ago
Saxon10.9 is the latest version that runs on .NET Framework, but for .NET Core (or simply .NET) you should be using SaxonCS 12.6. Both are built from the Java source code, but in very different ways, so performance characteristics might be different. I don't know if your license will cover the latest version.
I haven't had much chance to look at your code. The XSLT code is Altova-generated code so it's pretty verbose and not easy to follow the logic. My immediate reaction would be that 30 seconds seems very slow. I tried it with SaxonJ from the command line (I don't have a Windows machine handy) and it took 977ms. So there's clearly something going wrong somewhere.
What timing do you get running a single transformation from the command line?
I looked at your C# driver code and that looks fine.
Updated by Arif Yayalar 3 months ago
just a single tranformation takes between 3-4 seconds
Updated by Michael Kay 3 months ago
OK, that's consistent with my Java figure, because the .NET product is often around a factor of 3-4 slower than Java (for reasons we have never fully understood). If it's taking 3 seconds in a single thread and 30 seconds with 10 threads that suggests that there's no real multithreading going on at all. What does the Console log look like?
Updated by Arif Yayalar 3 months ago
We run the requests in Parallel.
Parallel.For(0, 10, _ =>
{
    saxon.RunTransformerEntEd();
});
From the console output, it looks like it is not running in parallel. Looks like it is executing serially. I wonder if there is a locking in Saxon API prevents these calls to execute in parallel.
Console output: Compile time: 1193 Compile time: 1193 Compile time: 1193 Compile time: 1193 Compile time: 1185 Compile time: 1193 Compile time: 1193 Compile time: 1193 Compile time: 1193 Transform time: 35974 Transform time: 38518 Transform time: 38747 Transform time: 38758 Transform time: 38772 Transform time: 38798 Transform time: 38864 Transform time: 38865 Transform time: 38872 Transform time: 38878
Updated by Michael Kay 3 months ago
Well, there's clearly some parallelism there, because it's running all the compiles, then all the transformations. But it does look rather like some lock is holding things back.
Updated by Arif Yayalar 3 months ago
Is there anything we can do the increase the performance?
Updated by Michael Kay 3 months ago
I haven't identified anything yet, but will work on it.
Updated by Michael Kay 3 months ago
I've now run your test case against SaxonCS 13.0 (under development) on .NET 6.0 on Mac. I know that's not your target environment but it's easiest for me to investigate on my current platform rather than setting up something new.
I'm getting the timings
Compile time: 395
Compile time: 395
Compile time: 395
Compile time: 395
Compile time: 396
Compile time: 394
Compile time: 395
Compile time: 395
Compile time: 395
Compile time: 396
Transform time: 19375
Transform time: 19386
Transform time: 19400
Transform time: 19405
Transform time: 19414
Transform time: 19428
Transform time: 19429
Transform time: 19432
Transform time: 19435
Transform time: 19475
Completed...
If I change the number of threads to 4, I get
Compile time: 277
Compile time: 277
Compile time: 277
Compile time: 277
Transform time: 5643
Transform time: 5643
Transform time: 5643
Transform time: 5645
and with 1 thread I get
Compile time: 236
Transform time: 2403
Updated by Michael Kay 3 months ago
I added a trace at the point where the transform starts, and I'm getting
Compile time for : 4 = 289
Compile time for : 1 = 289
Compile time for : 0 = 289
Compile time for : 3 = 289
Compile time for : 2 = 289
Start transform : 0
Start transform : 2
Start transform : 3
Start transform : 4
Start transform : 1
Transform time for : 2 = 7776
Transform time for : 3 = 7776
Transform time for : 4 = 7776
Transform time for : 1 = 7777
Transform time for : 0 = 7779
So it's pretty clear that they are running concurrently rather than sequentially.
I'll come back to this after the weekend.
Updated by Michael Kay 3 months ago
Sorry, I wasn't changing the number of threads, I was changing the total number of transformations performed. What we're seeing essentially is that running them in parallel takes more or less the same total amount of time as running them sequentially.
Updated by Arif Yayalar 3 months ago
if I run them serially, I see better results. However, this is not ideal.
Compile time: 67
Transform time: 3535
Compile time: 61
Transform time: 1964
Compile time: 51
Transform time: 1980
Compile time: 49
Transform time: 2436
Compile time: 33
Transform time: 2268
Compile time: 53
Transform time: 1890
Compile time: 46
Transform time: 2434
Compile time: 58
Transform time: 1909
Compile time: 51
Transform time: 1851
Compile time: 51
Transform time: 1842
Compile time: 47
Transform time: 1949
Compile time: 47
Transform time: 2310
Compile time: 49
Transform time: 2451
Compile time: 48
Transform time: 1974
Compile time: 45
Updated by Michael Kay 3 months ago
What are you trying to achieve? Are you trying to optimize throughput or latency?
Updated by Arif Yayalar 3 months ago
Both. We get 100s of requests per sec that we need to keep the xslt compile/transform as efficient as possible.
Updated by Michael Kay 3 months ago
Well, it's going to be a trade-off, isn't it?
I've tried running 20 transformations with different number of threads, and the figures (threads / av. transform time / total time / throughput):
2 / 2998 /31943 /  0.62
3 / 4218 / 31025 / 0.65
4 / 5347 / 28704 / 0.69
5 / 7763 / 32240 / 0.62
6 / 9948 / 34707 / 0.57

10 / 20636 / 42734 / 0.46
I'm running this on a machine with 4 cores, so as you would expect for a CPU-dominated workload, the throughput is highest with a concurrency of 4, but the latency is smaller with a lower number of threads. There is no benefit in having more threads than you have processors available, This is all very much what one would expect.
I don't know how many threads Parallel.For allocates by default. I'm sure there are more sophisticated ways of tuning the scheduling of parallel workloads on .NET, but the basic pattern is likely to remain the same.
Updated by Michael Kay 3 months ago
I thought it might be interesting to look at the actual XSLT code, so I profiled it (on Java) using -TP:profile.html All this reveals is that nearly all the time is spent in the xsl:template match="/" root template, but that's hardly surprising since that accounts for 99% of the stylesheet. With monolithic code like this, the profiling isn't much use.
It's 10,000 lines of very turgid generated code, so no real prospect of examining it by hand.
A Java profile reveals nothing untoward.
I now there have been problems with performance with very large templates/functions like this in the past, but IIRC they were compile-time problems rather than run-time, and the compile time for the stylesheet looks OK.
Updated by Michael Kay 3 months ago
OK, let's stand back.
You say you need to handle hundreds of requests a second, and each request is taking two or three seconds of CPU to execute, when run in a single thread. That's only going to be viable if you distribute the workload across hundreds of CPUs.
I strongly suspect the XSLT code could be made to go much faster. On the face of it it looks like a fairly uncomplicated transformation, Because it is generated code, it's doing a lot of unnecessary work, for example there are far more local variables than are needed. Saxon gives up on trying to optimize a template/function as big as this, because the cost of optimization increases exponentially with the size of the function or template. I suspect that means it's not even going to do trivial optimizations like replacing the expression xs:double(xs:decimal('2')) (line 11742) by the constant 2.0e0. But rewriting it by hand is a fairly daunting prospect (especially as you suggest this is just one of hundreds of different stylesheets), However, I would think it's feasible for a hand-written stylesheet to do the job in under 100ms.
Perhaps, because it's generated code, it's regular enough that you could consider attempting some automated rewrites? I've no idea what kind of improvement you might expect but it might be worth experimenting.
The only alternative seems to be to buy lots of hardware (or cloud capacity) and put in some load-sharing infrastructure to distribute the workload.
Running on Java rather than .NET might give you a 3-4 times improvement, which would be a good start.
Updated by Michael Kay 3 months ago
Running on Java rather than .NET might give you a 3-4 times improvement, which would be a good start.
In fact on Java it's running in about 117ms, which is a much more reasonable time for this kind of transformation.
Updated by Arif Yayalar 3 months ago
Sorry I haven't responded in a while. For some reason I didn't get any email alerts. Java is no starter for us. XSLTs are generated by an Altova XML tool. They're not hand crafted. I agree some optimization needed with them. However, the degraded performance of Saxon under load/concurrency seems to be a bug in the Saxon library. When I run a single transform vs 10. The difference should not be from 2 sec. to 30 sec.
Updated by Michael Kay 3 months ago
The performance doesn't appear "degraded" to me. If you ask a processor to run thirty things at once then each of those things is going to take thirty times as long as when you ran them one at a time, given that the task is CPU limited. If you have multiple CPUs, then running tasks in parallel will give a benefit, but only up to the number of CPUs available. By varying the number of threads allocated to the Parallel.ForEach, I was able to show that peak throughput was obtained when the number of threads is equal to the number of CPUs, which is exactly what you should expect.
I'm afraid that the only solutions I see for improving the performance of this workload are (a) hand-tuning the monolithic Altova-generated code, (b) running under Java rather than .NET, or (c) allocating a lot more hardware. I do understand that none of those solutions is particularly appealing.
 Updated by Vladimir Nesterovsky 3 months ago
Per diagnostic screen attached we can see that CPU is under low load.
Can it be due to some io contention, or console contention (are there a lot of console output)?
Updated by Michael Kay 3 months ago
Thanks for your input, Vladimir. I didn't pay much attention to that screenshot because it only shows activity 5m into the run, so there's not much there to see. As my notes indicate, I didn't actually run this workload under exactly the same conditions (I ran it using SaxonCS on Mac, and under SaxonJ) but my results were consistent with those observed, and with those you would expect: if you start up 30 threads and run the same transformation in each one, then each transformation takes 30 times as long as it does when it is the only thing running.
Updated by Vladimir Nesterovsky 3 months ago
I would not post to this thread if I were not in similar situation, which is a process running N parallel transformations, where N equals to the number of CPU cores. It worked slow without any real justification, as CPU usage was very low.
It's turned, I was searching for solution in the wrong place.
At larger scale I had a shell executing ant build that triggered process with parallel xslts. This setup piped console outputs from shell to ant to process with xslts.
Each xslt transformation issued just several xsl:message instructions, and whole process produced something like 100Kb of logs. It turns out that pipe between processes might turn into something very slow.
In my case solution was to not pipe processes but redirect output to a file.
Updated by Arif Yayalar 3 months ago
Michael, your theory about running more threads than the number of CPUs doesn't apply in my scenario. I am running 10 parallel executions. I have 14 cores and 20 logical processors.
Updated by Michael Kay 3 months ago
So what results do you get when you measure throughput against concurrency?
Updated by Arif Yayalar 3 months ago
Results are below. You can also reproduce these results with the sample solution I've provided.
One transform:
Compile time: 808
Transform time: 2866
10 concurrent transforms:
Compile time: 167
Compile time: 163
Compile time: 177
Compile time: 178
Compile time: 200
Compile time: 176
Compile time: 214
Compile time: 207
Compile time: 207
Compile time: 224
Transform time: 27404
Transform time: 27985
Transform time: 28185
Transform time: 28490
Transform time: 28465
Transform time: 28661
Transform time: 28691
Transform time: 28729
Transform time: 28869
Transform time: 28723
Updated by Vladimir Nesterovsky 3 months ago
I would suggest to try to isolate things.
Can you make sure that all inputs and outputs are processed from memory streams, and that nothing is printed in console during the transformations?
Updated by Arif Yayalar 3 months ago
Hi Vlad, here is the test method I use. Let me know if you see something out of ordinary or used incorrectly.
        public void SaxonTransform(Processor processor)
        {
            using var xsltFileStream = new FileStream(XsltFilePath, FileMode.Open, FileAccess.Read);
            using var xsltBufferedStream = new BufferedStream(xsltFileStream);
            using var xsltReader = new StreamReader(xsltBufferedStream);

            using var xmlFileStream = new FileStream(XmlFilePath, FileMode.Open, FileAccess.Read);
            using var xmlBufferedStream = new BufferedStream(xmlFileStream);
            using var xmlReader = new StreamReader(xmlBufferedStream);

            var xmlReaderSettings = new XmlReaderSettings
            {
                CloseInput = true
            };
            var reader = XmlReader.Create(xmlReader, xmlReaderSettings);

            var docBuilder = processor.NewDocumentBuilder();
            docBuilder.BaseUri = BaseUri;

            var input = docBuilder.Build(reader);

            var compiler = processor.NewXsltCompiler();
            compiler.BaseUri = BaseUri;

            var sw = new Stopwatch();
            sw.Start();
            var xsltExecutable = compiler.Compile(xsltReader);
            sw.Stop();

            Console.WriteLine("Compile time: " + sw.ElapsedMilliseconds);

            var transformer = xsltExecutable.Load();
            transformer.InputXmlResolver = new XmlUrlResolver();

            // transformer.SetParameter(new QName("interfaceVersion"), new XdmAtomicValue("0"));

            var dateFormatParam = new XdmAtomicValue("yyyy-MM-dd'T'HH:mm:ss");
            transformer.SetParameter(new QName("", "DATE_FORMAT"), dateFormatParam);

            var batchIdParam = new XdmAtomicValue("12345");
            transformer.SetParameter(new QName("", "CALCULATE_PAYMENT_BATCHID"), batchIdParam);

            var checkAmountParam = new XdmAtomicValue("1000.00");
            transformer.SetParameter(new QName("", "CALCULATE_CHECK_AMOUNT"), checkAmountParam);

            transformer.InitialContextNode = input;

            var serializer = processor.NewSerializer();
            using var memoryStream = new MemoryStream();
            using var textWriter = new StreamWriter(memoryStream);
            serializer.SetOutputWriter(textWriter);

            sw.Reset();
            sw.Start();
            transformer.SchemaValidationMode = SchemaValidationMode.None;
            transformer.Run(serializer);
            sw.Stop();
            Console.WriteLine("Transform time: " + sw.ElapsedMilliseconds);
            serializer.Close();
            transformer.Close();
        }
Updated by Vladimir Nesterovsky 3 months ago
here is the test method I use.
That is what I assumed.
To avoid measuring file system performance and its bottlenecks can you preaload files into byte arrays?
Same for console - use some synchronized list of strings that you will print later.
This way you will be able to tell who consumes more time?
Updated by Arif Yayalar 3 months ago
With your recommended changes, I don't see any difference
Compile time: 1261
Compile time: 1262
Compile time: 1263
Compile time: 1265
Compile time: 1264
Compile time: 1266
Compile time: 1266
Compile time: 1260
Compile time: 1262
Compile time: 1261
Transform time: 29288
Transform time: 32633
Transform time: 34332
Transform time: 34535
Transform time: 34945
Transform time: 35004
Transform time: 35063
Transform time: 35077
Transform time: 35079
Transform time: 35096
        public void SaxonTransform(Processor processor)
        {
            var stream = new MemoryStream(XsltFilePath);
            stream.Position = 0;
            using var xsltReader = new StreamReader(stream);
            var memoryStream1 = new MemoryStream(XmlFilePath);
            memoryStream1.Position = 0;
            using var xmlReader = new StreamReader(memoryStream1);

            var xmlReaderSettings = new XmlReaderSettings
            {
                CloseInput = true
            };
            var reader = XmlReader.Create(xmlReader, xmlReaderSettings);

            var docBuilder = processor.NewDocumentBuilder();
            docBuilder.BaseUri = BaseUri;

            var input = docBuilder.Build(reader);

            var compiler = processor.NewXsltCompiler();
            compiler.BaseUri = BaseUri;

            var sw = new Stopwatch();
            sw.Start();
            var xsltExecutable = compiler.Compile(xsltReader);
            sw.Stop();

            _consoleOutput.Add("Compile time: " + sw.ElapsedMilliseconds);

            var transformer = xsltExecutable.Load();
            transformer.InputXmlResolver = new XmlUrlResolver();

            // transformer.SetParameter(new QName("interfaceVersion"), new XdmAtomicValue("0"));

            var dateFormatParam = new XdmAtomicValue("yyyy-MM-dd'T'HH:mm:ss");
            transformer.SetParameter(new QName("", "DATE_FORMAT"), dateFormatParam);

            var batchIdParam = new XdmAtomicValue("12345");
            transformer.SetParameter(new QName("", "CALCULATE_PAYMENT_BATCHID"), batchIdParam);

            var checkAmountParam = new XdmAtomicValue("1000.00");
            transformer.SetParameter(new QName("", "CALCULATE_CHECK_AMOUNT"), checkAmountParam);

            transformer.InitialContextNode = input;

            var serializer = processor.NewSerializer();
            using var memoryStream = new MemoryStream();
            using var textWriter = new StreamWriter(memoryStream);
            serializer.SetOutputWriter(textWriter);

            sw.Reset();
            sw.Start();
            transformer.SchemaValidationMode = SchemaValidationMode.None;
            transformer.Run(serializer);
            sw.Stop();
            _consoleOutput.Add("Transform time: " + sw.ElapsedMilliseconds);
            serializer.Close();
            transformer.Close();
        }
Updated by Arif Yayalar 3 months ago
The files loaded in byte[] array outside of the method
  private static byte[] XsltFilePath => File.ReadAllBytes(@".\pay.xslt");
  private static byte[] XmlFilePath => File.ReadAllBytes(@".\pay.xml");
Updated by Arif Yayalar 3 months ago
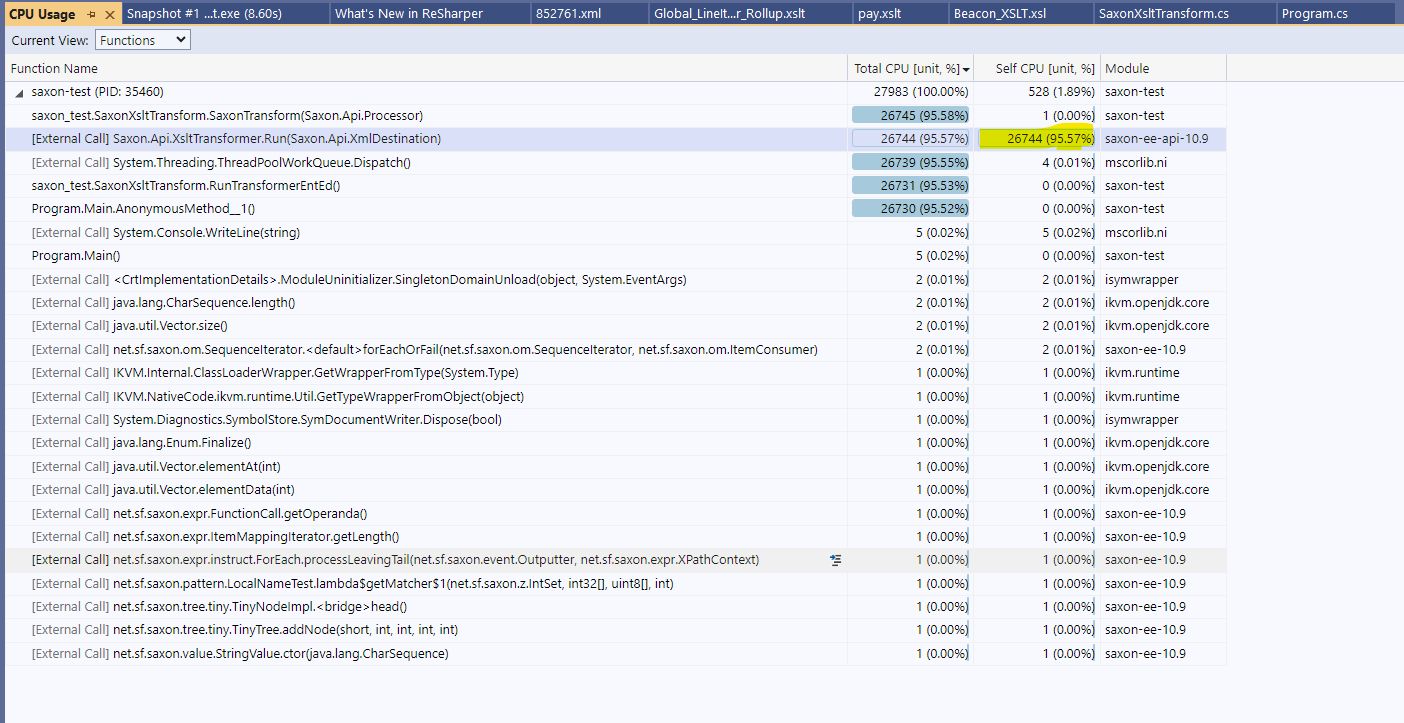
Here is a CPU diagnostics snapshot. You can see where the CPU time is spent.
Updated by Vladimir Nesterovsky 3 months ago
Are you able to drill down into execution hot paths? If not in Visual Studio, then PerfView would allow this. Though PerfView is not such a modern tool it might give more insights.
Updated by Arif Yayalar 3 months ago
Honestly, I don't have bandwidth to that. I am contacting support to figure this out on their end. If we can't get the performance we need from Saxon, we need evaluate other options.
Updated by Vladimir Nesterovsky 3 months ago
Can you please upload project once more? This time without secrets inside.
I may look at profiling info on my side when I'll have some spare time.
Note: This might be interesting for me, as I have a large xslt code base that employs parallel execution but more successfully than attempt you show here. If I'll find some bottlenecks, it might help with my code as well.
Updated by Arif Yayalar 3 months ago
- File saxon-test-upload.zip saxon-test-upload.zip added
Here you go
Updated by Vladimir Nesterovsky 3 months ago
Attached file does not contain xml and xslt payload.
Do you mean that the problem is reproducible with arbitrary input and xslt?
Updated by Arif Yayalar 3 months ago
Unfortunately I cannot share those files. Company property.
Please register to edit this issue