
 Performance Profiling for Saxon-JS
Added by Nik Osvalds almost 4 years ago
Can anyone provide some guidance on pinpointing the bottleneck in a transform?
This is a node.js implementation of Saxon-JS. I'm trying to increase the speed of transforming some XML documents so that I can provide a Synchronous API that responds in under 60sec ideally (230sec is the hard limit of the Application Gateway). I need to be able to handle up to 50MB size XML files as well.
I've run node's built profiler (https://nodejs.org/en/docs/guides/simple-profiling/). But it's tough to make sense of the results given that the source code of the free version of Saxon-JS is not really human-readable.
My Code
const path = require('path');
const SaxonJS = require('saxon-js');
const { loadCodelistsInMem } = require('../standards_cache/codelists');
const { writeFile } = require('../config/fileSystem');
const config = require('../config/config');
const { getStartTime, getElapsedTime } = require('../config/appInsights');

// Used for easy debugging the xslt stylesheet
// Runs iati.xslt transform on the supplied XML
const runTransform = async (sourceFile) => {
    try {
        const fileName = path.basename(sourceFile);

        const codelists = await loadCodelistsInMem();

        // this pulls the right array of SaxonJS resources from the resources object
        const collectionFinder = (url) => {
            if (url.includes('codelist')) {
                // get the right filepath (remove file:// and after the ?
                const versionPath = url.split('schemata/')[1].split('?')[0];
                if (codelists[versionPath]) return codelists[versionPath];
            }
            return [];
        };

        const start = getStartTime();
        const result = await SaxonJS.transform(
            {
                sourceFileName: sourceFile,
                stylesheetFileName: `${config.TMP_BASE_DIR}/data-quality/rules/iati.sef.json`,
                destination: 'serialized',
                collectionFinder,
                logLevel: 10,
            },
            'async'
        );
        console.log(`${getElapsedTime(start)} (s)`);

        await writeFile(`performance_tests/output/${fileName}`, result.principalResult);
    } catch (e) {
        console.log(e);
    }
};

runTransform('performance_tests/test_files/test8meg.xml');
Example console output:
❯ node --prof utils/runTransform.js
SEF generated by Saxon-JS 2.0 at 2021-01-27T17:10:38.029Z with -target:JS -relocate:true
79.938 (s)
❯ node --prof-process isolate-0x102d7b000-19859-v8.log > v8_log.txt
The stylesheet: https://github.com/IATI/IATI-Rulesets/blob/master/rules/iati.xslt
Example XML is attached
Snippet of the V8 log of the largest performance offender:
 [Bottom up (heavy) profile]:
  Note: percentage shows a share of a particular caller in the total
  amount of its parent calls.
  Callers occupying less than 1.0% are not shown.

   ticks parent  name
  33729   52.5%  T __ZN2v88internal20Builtin_ConsoleClearEiPmPNS0_7IsolateE
   6901   20.5%    T __ZN2v88internal20Builtin_ConsoleClearEiPmPNS0_7IsolateE
   3500   50.7%      T __ZN2v88internal20Builtin_ConsoleClearEiPmPNS0_7IsolateE
   3197   91.3%        LazyCompile: *k /Users/nosvalds/Projects/validator-api/node_modules/saxon-js/SaxonJS2N.js:287:264
   3182   99.5%          LazyCompile: *<anonymous> /Users/nosvalds/Projects/validator-api/node_modules/saxon-js/SaxonJS2N.js:682:218
   2880   90.5%            LazyCompile: *d /Users/nosvalds/Projects/validator-api/node_modules/saxon-js/SaxonJS2N.js:734:184
Thanks a lot. There aren't a ton of resources on this anymore to walk myself through. I've also already tried:
- Using the stylesheetInternal parameter with pre-parsed JSON (didn't make a large difference)
- Splitting the document into separate documents that only contain one activities
<iati-activity>child element inside the root<iati-activities>root element, transforming each separately, and putting it back together this ended up taking 2x as long.
Best,
Nik
| test8meg.xml (8.61 MB) test8meg.xml | |||
| v8_log.txt (205 KB) v8_log.txt |
Replies (2)
 RE: Performance Profiling for Saxon-JS
-
Added by Michael Kay almost 4 years ago
RE: Performance Profiling for Saxon-JS
-
Added by Michael Kay almost 4 years ago
Thanks for the enquiry.
As it happens, we have been developing tools for instrumenting stylesheets on Node.js, but there's nothing available yet as product. I'm afraid that the bad news is that we're hoping to make some money out of add-ons like this: we've invested an enormous about of effort into creating the Saxon-JS technology and we need to think about how to get some revenue back so that we can invest in further development. We do have the beginnings of a commercial service offering that will provide early access to tools like this: feel free to talk to us about this.
The initial tooling is something very similar to the -TP:profile.html option on the Java product. If you can package up your code in such a way that we can run it, I'll be happy to try it out for you and show you what the output looks like.
It's useful to start by splitting the cost into
-
stylesheet compilation (creating the SEF file) -- easily isolated
-
source document parsing -- use the Saxon-JS API to build the XML tree without doing a transformation
-
transformation cost
-
serialization cost (the best way to measure this is to see how much faster it goes if you just send the transformation output to a tree in memory which you discard).
If performance is important then it's probably worth trying the XJ (Java) compiler - get an evaluation license for Saxon-EE and try it out. The compiler itself is faster (by a factor of about 3-5) and it also generates smaller and more efficient code; it has a much more sophisticated optimizer.
The -TP profiling tool is useful if transformation is the bottleneck -- which is likely if the transformation time is over a minute. It wouldn't do any harm to try the profiling tool on the Java product; the bottlenecks in your stylesheet are quite likely to be in the same place regardless of the execution engine.
Profiling at the Javascript level is very unlikely to yield any insights, not only because the issued Javascript (which has been compiled using the Closure compiler with advanced optimisation) is extremely obscure, but also because knowing what bits of Saxon are working the hardest doesn't translate in anything that's useful for tuning your application.
Another useful tip: try to determine how performance scales with document size. Is it linear, or quadratic? Measure with different size source documents to find out. If you're seeing quadratic (or worse) performance, then it's usually possible to find out why just from looking at your stylesheet logic. And that leads to another tip: very often poor XSLT performance on large source documents can be fixed using xsl:key. Just look for the places where you are doing whole-document searches using constructs like //x[@y = $search-term].
Let us know how you get on. This is a new product so the more feedback we get, the better.
RE: Performance Profiling for Saxon-JS
-
Added by Nik Osvalds almost 4 years ago
Hey Michael,
Appreciate the quick and detailed response. I will see where I can get with the -TP profiling tool on Java and your other tips. Depending on how far I get there and the budget I have to work with I'll come back to you on the JS stylesheet instrumentation.
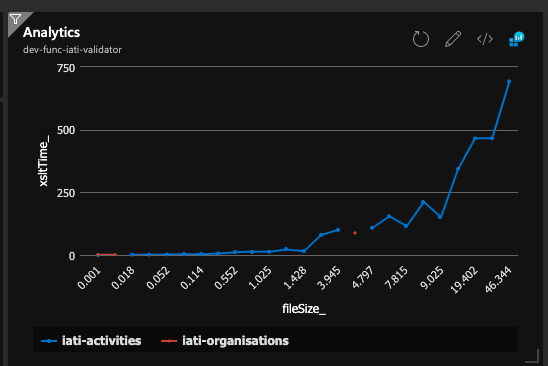
As far a plotting it, I need to collect more data points, but I think you could say this looks quadratic!
Please register to reply